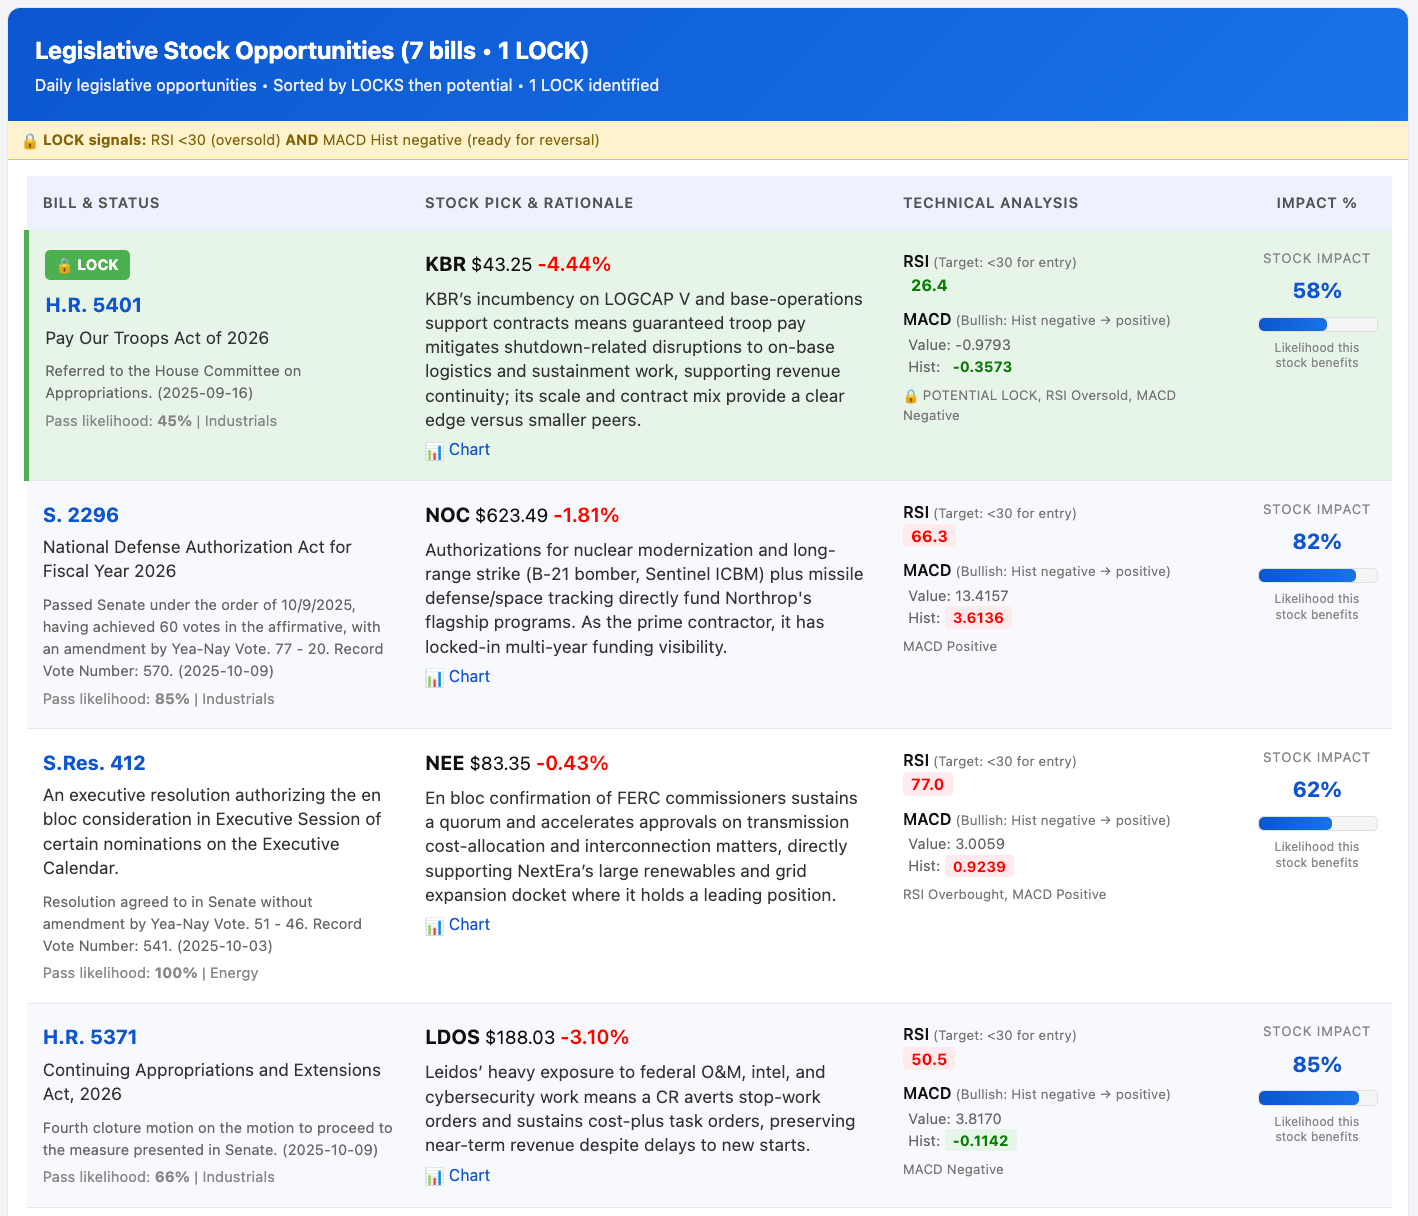
legislative-stock-opportunities
NSC
NVO
SPY
MSFT
BLDR
legislative-stock-opportunities
CACI
NVO
SPY
VVX
BLDR
NWSA
MSFT
legislative-stock-opportunities
CACI
LLY
MSFT
BLDR
META
SPY
legislative-stock-opportunities
CACI
NVO
MSFT
DHI
NWSA
SPY
legislative-stock-opportunities
CACI
LLY
MSFT
NVR
GEO
legislative-stock-opportunities
CACI
LLY
MSFT
NVR
NWSA
SPY
legislative-stock-opportunities
LLY
CACI
MSFT
TRV
UAL
GEO
LRN
legislative-stock-opportunities
LLY
CACI
MSFT
TRI
UAL
DJT
LRN
legislative-stock-opportunities
LLY
PLTR
MSFT
DJT
AAL
GEO
LRN
legislative-stock-opportunities
LLY
CACI
META
MSFT
UAL
LRN
legislative-stock-opportunities
LLY
CACI
MSFT
TRMB
UAL
DJT
SCHL
legislative-stock-opportunities
LLY
CACI
DJT
MSFT
UAL
LRN
legislative-stock-opportunities
LLY
IDEM
MSFT
DCBO
UAL
PLUS
legislative-stock-opportunities
NVO
NLOK
GEO
DUOL
LDOS
JOBY
legislative-stock-opportunities
LLY
IDEM
MSFT
PSO
SSNC
HEI
legislative-stock-opportunities
LLY
IDEM
LMT
DDOG
EVC
AVAV
legislative-stock-opportunities
NVO
IDCC
NOC
TOST
FOXA
TXT
legislative-stock-opportunities
LLY
IDXX
RELX
DUOL
PLTR
LHX
legislative-stock-opportunities
LLY
IDEM
CME
DUOL
TDY
legislative-stock-opportunities
LLY
IDEM
ICE
TPTX
CACI
AVAV
legislative-stock-opportunities
EXLS
LLY
LDOS
GEO
CME
ACN
legislative-stock-opportunities
IDEM
LLY
CACI
ICE
NEE
ACN
legislative-stock-opportunities
CACI
NVO
GEO
META
CME
ACN
legislative-stock-opportunities
IDEM
LLY
PANW
ICE
ACN
legislative-stock-opportunities
TYL
LLY
GD
MSFT
CACI
legislative-stock-opportunities
IDEM
LLY
PLTR
ICE
CW
DLB
legislative-stock-opportunities
IDEM
NVO
DDS
THO
NWSA
ACN
legislative-stock-opportunities
IDEM
NVO
MLCO
WBD
DHI
ICE
legislative-stock-opportunities
IDEM
LLY
DOMO
HII
DHI
LDOS
LMT
legislative-stock-opportunities
IDEM
NVO
DOCU
LDOS
PHM
AJRD
legislative-stock-opportunities
KN
LLY
SCI
LMT
DHI
IDEM
FOX
legislative-stock-opportunities
IDEM
LLY
NICE
MSFT
DHI
legislative-stock-opportunities
ACN
NVO
CACI
MSFT
DHI
IDEM
CME
legislative-stock-opportunities
IDEM
LLY
PLTR
LEN
IDEX
MSFT
legislative-stock-opportunities
NSSCY
AON
NVO
FCX
NYT
COIN
legislative-stock-opportunities
IDEM
KBR
LLY
ALB
TRMB
COIN
legislative-stock-opportunities
EPC
ICE
NVO
FCX
ACN
COIN
legislative-stock-opportunities
IDEM
CME
LLY
FCX
LMT
COIN
legislative-stock-opportunities
IDEM
NOC
LLY
PWR
SPGI
COIN
legislative-stock-opportunities
LMT
CBOE
LLY
MP
ICE
COIN
legislative-stock-opportunities
IDEX
PLTR
LLY
MP
GEO
COIN
legislative-stock-opportunities
CME
GEO
MSTR
COIN
MSFT
legislative-stock-opportunities
MSFT
CACI
MX
COIN
CME
legislative-stock-opportunities
LMT
IDEM
GEO
COIN
DTEGY
legislative-stock-opportunities
ICE
IDCC
GEO
COIN
legislative-stock-opportunities
SPGI
TYL
GEO
COIN
TRI
legislative-stock-opportunities
LMT
SCI
ACN
GEO
COIN
AXON
legislative-stock-opportunities
IDEM
PLTR
GD
SOFI
BAH
PANW
CLF
legislative-stock-opportunities
IDEM
MSFT
LMT
SOFI
BAH
GEO
LDOS
CCJ
legislative-stock-opportunities
MANT
NWSA
LMT
JPM
LDOS
CLF
legislative-stock-opportunities
LDOS
MSGS
LMT
SOFI
FOX
RGLD
legislative-stock-opportunities
TYL
NWSA
HCA
AXP
SAIC
FOX
LMT
RIO
legislative-stock-opportunities
MANT
NWSA
HUM
JPM
LDOS
LMT
RIO
legislative-stock-opportunities
LDOS
NWSA
LMT
SOFI
FOX
CLF
legislative-stock-opportunities
LLY
NWSA
BFH
TYL
COIN
LDOS
LMT
legislative-stock-opportunities
LLY
CMCSA
LDOS
AXP
FOX
COIN
CXW
LMT
legislative-stock-opportunities
LLY
NWSA
LMT
ALLY
NOC
COIN
LDOS
legislative-stock-opportunities
LLY
NWSA
LMT
AAPL
FOX
LDOS
COIN
legislative-stock-opportunities
LLY
NWSA
GE
JPM
FOX
LDOS
COIN
CACI
LMT
legislative-stock-opportunities
LLY
NWSA
ACM
SOFI
FOX
JPM
COIN
CXW
LMT
legislative-stock-opportunities
LLY
FOX
SQ
LMT
NWSA
MSFT
legislative-stock-opportunities
LLY
NWSA
SQ
LMT
LHX
MSFT
legislative-stock-opportunities
LLY
NWSA
BRK.B
LMT
FOX
ACM
LDOS
legislative-stock-opportunities
LLY
NWSA
AAPL
LMT
MSFT
legislative-stock-opportunities
LLY
FOX
SOFI
LMT
MSFT
legislative-stock-opportunities
LLY
NWSA
WMT
LMT
FOX
LDOS
MSFT
legislative-stock-opportunities
LLY
NWSA
SOFI
LMT
CDAY
legislative-stock-opportunities
LLY
NXST
PYPL
LMT
NWSA
MSFT
legislative-stock-opportunities
LLY
NWSA
TTEK
LMT
FOXA
SWBI
ICLR
JPM
legislative-stock-opportunities
LLY
FOX
PCOR
LMT
NWSA
SWBI
IQV
WU
legislative-stock-opportunities
LLY
NWSA
TRMB
LMT
SWBI
IQV
AXP
legislative-stock-opportunities
LLY
NWSA
MTZ
LMT
SWBI
ICLR
WFC
legislative-stock-opportunities
LLY
NWSA
ACM
LMT
FOX
SWBI
IQV
WU
legislative-stock-opportunities
LLY
NWSA
PCOR
LMT
FOX
SWBI
IQV
WU
legislative-stock-opportunities
LLY
NWSA
ACM
LMT
SWBI
IQV
legislative-stock-opportunities
LLY
MSGS
LMT
FOX
PLTR
ICLR
CXW
legislative-stock-opportunities
LLY
NWSA
LMT
PLTR
TMO
WU
legislative-stock-opportunities
LLY
FOX
LMT
NWSA
IQV
legislative-stock-opportunities
LLY
NWSA
LMT
FOX
IQV
legislative-stock-opportunities
LLY
NWSA
LMT
FOX
IQV
legislative-stock-opportunities
LLY
NWSA
LMT
PLTR
IQV
legislative-stock-opportunities
LLY
NWSA
LMT
PLTR
ICLR
legislative-stock-opportunities
LLY
LMT
DLTR
NWSA
UNH
WM
ZTS
legislative-stock-opportunities
LLY
LMT
HCA
NWSA
CI
NEE
ZTS
legislative-stock-opportunities
LLY
LMT
HCA
FOX
UNH
WM
ZOETIS
legislative-stock-opportunities
LLY
LMT
TDOC
NWSA
CI
BLD
ZTS
legislative-stock-opportunities
LLY
LMT
HCA
MSCI
CNC
WM
ZTS
legislative-stock-opportunities
LLY
LMT
CNC
NWSA
CI
AECOM
ZTS
legislative-stock-opportunities
LLY
LMT
HCA
NWSA
UNH
ACM
ZTS
legislative-stock-opportunities
LLY
LMT
NWSA
PAYC
MSFT
legislative-stock-opportunities
LLY
LMT
NWSA
CACI
PAYX
POL
legislative-stock-opportunities
LLY
LMT
NWSA
CXM
ADP
BR
legislative-stock-opportunities
LLY
LMT
NWSA
CXW
ADP
POL
legislative-stock-opportunities
LLY
LMT
NWSA
LDOS
ADP
POL
legislative-stock-opportunities
LLY
LMT
NWSA
CXW
ADP
CDW
legislative-stock-opportunities
LLY
LMT
FOX
CSCO
ADP
CACI
legislative-stock-opportunities
LLY
NWSA
LDOS
LMT
GEO
legislative-stock-opportunities
LLY
NWSA
SAIC
LMT
CXW
legislative-stock-opportunities
LLY
NWSA
BK
LMT
GEO
legislative-stock-opportunities
LLY
NWSA
PLTR
LMT
GEO